In my previous article called DB2 9
and Microsoft Excel 2007: Getting the Data DB2 9, I showed you how easy it
is to get data from an IBM DB2 9 data server into your Excel 2007 worksheets. I
also showed you some of the neat Excel 2007 capabilities to ‘dress-up’ your
data. In this article, I want to leverage the framework we created in the last
article and show you how to create and populate (with DB2 9 data) one of the
most important and capable data analysis tools around: pivot tables.
A what table did you say?
A pivot table is an interactive table that presents itself
to users in an organized and summarized fashion. It can be instantly rotated to
view data in multiple dimensions to detect patterns and relationships, and
discover trends.
The best way to understand this concept is through an
example. Assume you have a bunch of data, for example, the salary and
commission payouts for all the employees in your company. You’re a data analyst
and now you want to get some meaningful insight into this data so you can
answer HR-related questions such as:
-
Are there any sales reps in a region with an underestimated quota?
(This would be identified by an abnormally large commission payout compared with
others in their department or across the organization.) -
Who is the highest performing sales person as a function of their
department, or as a function of a job type? -
Which department is the highest performing with respect to sales and
commissions? Which are the highest performing job categories within a specific
department?
You can answers questions like these and more using a pivot
table.
Of course, its name suggests this object’s most compelling
feature – the ability to easily pivot. Using a pivot table, you can graphically
change the display of the table such that a certain type of information is
displayed in rows and then instantly displayed as columns (the pivot). The
interactive nature of a pivot table lets you literally spin the table to see
different summaries of the data.
This might not seem complex to you if you are used to
working with Online Analytical Processing (OLAP) cubes; however, consider the
following data definition language (DDL) statements for a relational engine:
CREATE TABLE DJAUTOSALES (year int, quarter int, results int)INSERT INTO DJSALES VALUES (2004,1,20),(2004,2,30),(2004,3,15),
(2004,4,10),(2005,1,18), (2005,2,40), (2005,3,12),(2005,4,27)
Let’s assume your first report
started out just listing the data by Year, Quarter, and Results as follows:
SELECT * FROM DJAUTOSALES
The previous DML would return the
following output:

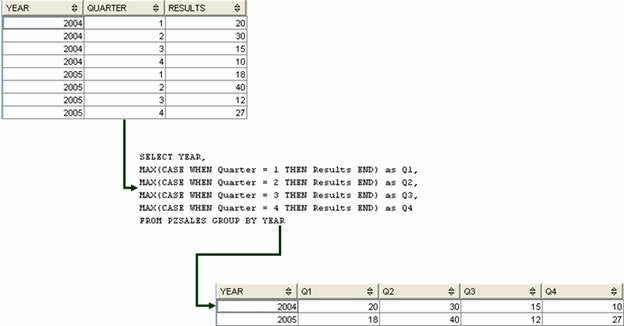
Now let’s pivot this table to get
some more interesting data. For example, you could use the following query to show
1 row per year with each column being the result of the sales by quarter (1
column per quarter):
SELECT YEAR, max(case when quarter = 1 THEN results end) as

Q1,max(case when quarter = 2 THEN results end) as Q2,

max(case when quarter = 3 THEN results end) as Q3,

max(case when quarter = 4 THEN results end) as Q4

FROM DJAUTOSALES GROUP BY YEAR
The previous DDL and DML statements would look like this:
Creating a pivot table with DB2 data
To create a pivot table using DB2 9 data in Microsoft Excel
2007, perform the following steps:
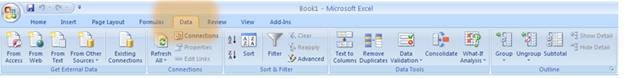
1. Open
up the Data ribbon by clicking the Data tab:
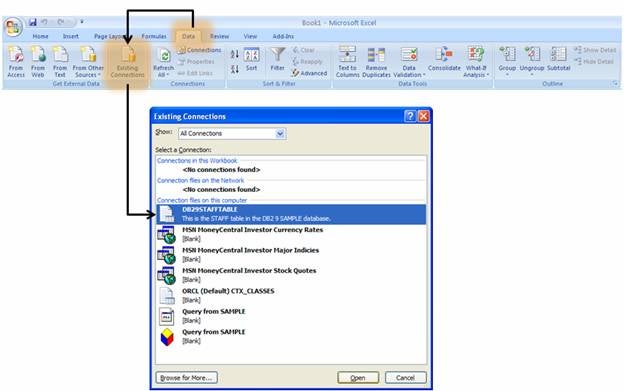
2. Click
Existing Connections and select the connection you created in the first
part of this series, select the DB29STAFFTABLE connection, and click
Open.
3. The
Import Data window opens. Use this window to specify what you want to create
and where you want the data to be placed. Select PivotChart and PivotTable
Report, and select OK:

You can see in the previous figure that you
can optionally select the data retrieved from DB2 9 to be placed as a regular
table in your worksheet (as in my previous article), or just as a pivot table
report without an accompanying chart.
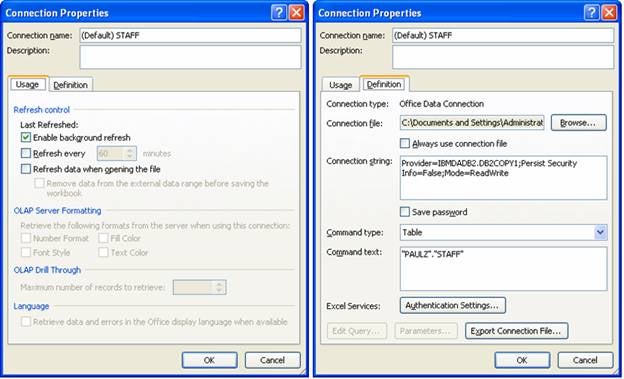
You can also use the Properties button to
further configure connection properties that relate to this data’s usage and
the definition of the connection string built by Excel 2007 to DB2 9:
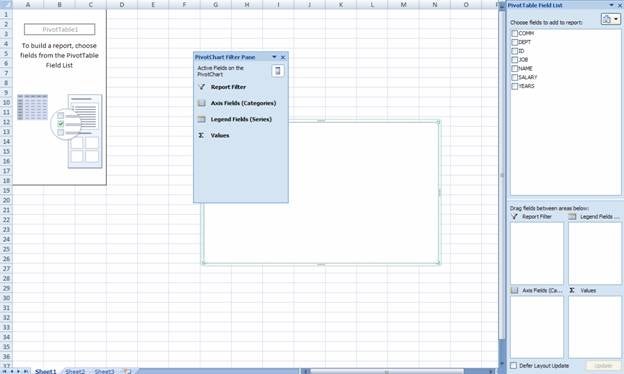
Excel 2007’s framework for Pivot Table opens:
A tour of the pivot table controls before you get started
Before I show you how to use this pivot table, it’s useful
to go over a couple of its features. The PivotChart Filter Pane allows
you to toggle on and off the actual columns and filters that you can apply to
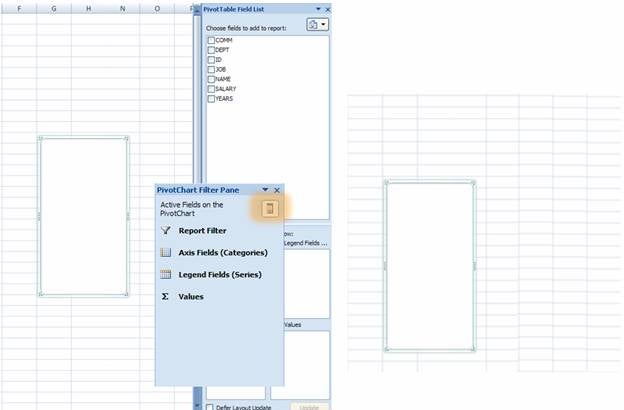
the pivot table report. Click the filter button (![]() )
)
to turn this filter on or off:
In order to use the PivotChart Filter Pane, you
need to have focus on the charting area. (The box in the previous diagram is
where Excel will build the pivot table.)
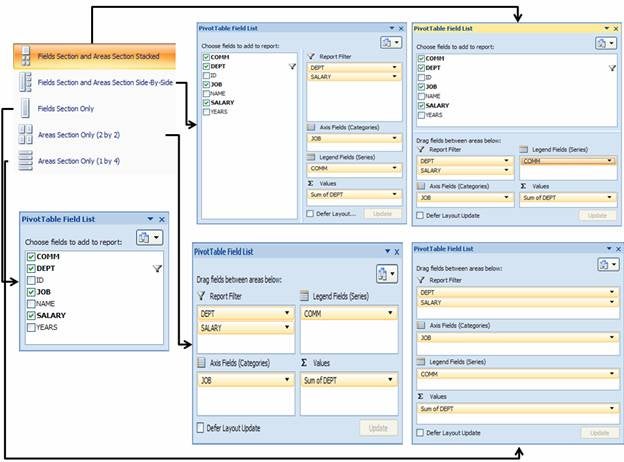
You use the Pivot Table Field List to drag fields to
your pivot table. The Fields Selection and Area Select Stacked button (![]() )
)
allows you to define how you’d like to see the fields, report filters, legends,
and values information displayed. This option gives you a granular level of
visual control that’s especially useful if you are dealing with a large amount of
data. For example, you might have such a large number of fields that it makes
sense to concentrate at the field level of the pivot table when creating it and
then focus on filtering data after you’ve defined columns for inclusion. You
have five options for the display, as shown below: