SQL Server Reporting Services (SSRS) has a report development/authoring tool called Report Designer (Business Intelligence Development Studio) for creating managed reports. Though Report Designer has an intuitive interface for creating simple to complex reports, it can be a little complex for business users who want to create ad-hoc reports. SQL Server Reporting Services has a separate tool called Report Builder (separate downloadable) created especially for business users to do ad-hoc reporting.
Report Builder 1.0 first came with SQL Server 2005 and has grown up with each subsequent release. We are going to deep dive with Report Builder 3.0, which comes with SQL Server 2008 R2.
Report Builder 3.0 is a new enhanced report authoring tool which has a familiar Office-like ribbon and some exciting new features. Some of these features are:
· Data Bar – A data bar is a special type of chart which we generally place inside a tablix for representing group value in the form of a bar with respect to other group values.
· Sparkline – It’s very much like data bar but often represents multiple data points over time to represent a single series.
· Indicator – Indicator generally shows trends by using directional images like arrows, ratings, etc., much like we used to have for KPI (Key Performance Indicator).
· Map – A map data visualization element combines data with geospatial data to be analyzed together. You can use map elements from map gallery, spatial data from SQL server or from ESRI (Environmental Systems Research Institute Inc.) shape files.
· Reusability – You can create Shared dataset and report parts from the report items which you can reuse in different other reports.
· Edit Session – While creating a report, very often you need to see the preview of your report or report layout. To improve the experience of previewing and to make it faster, Report Builder now has a feature called Edit Session. The edit session creates data cache when you are connected to report server and makes the data in data cache available for repeating report preview as long as you have only changes in the layout of the report. By default cache gets refreshed every two hours (though you can change this default setting) or whenever you reset (Refresh) it.
Apart from these there are couple more new feature/enhancements. You can connect to SQL Azure/SQL Server Parallel Data warehouse/SharePoint lists, an updated graphical query designer, enhancement in reporting layout and rendering, nesting of aggregate functions, enhanced support for expressions. For more information click here.
Getting started with Report Builder 3.0
Report Builder 3.0 is a separate download which you can download either from Report Manager home page or from Microsoft Download Center. Once downloaded and installed you can go to either Report Manager or click on Report Builder 3.0 under Mthe icrosoft SQL Server 2008 R2 Report Builder 3.0 program menu to launch it. The Getting Started page of Report Builder 3.0 lets you create a new report (with either Table of Matrix Wizard, Chart Wizard, Map Wizard or Blank Report), new dataset, open an already created report or open a recent report.
As I want to create a tablix report, I chose Table and Matrix Wizard as you can see below:
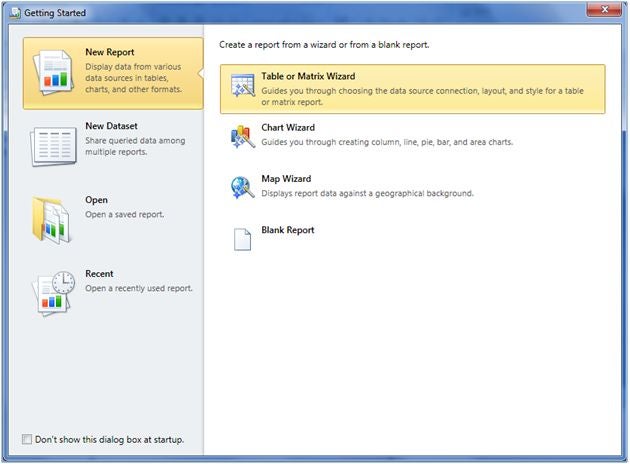
Figure 1 – Getting Started Page
The first screen of the wizard lets you specify or create a new data source. You can choose an existing dataset from the current report or a shared dataset for this report item or create a new one. As I am creating a report for the first time, I have chosen to create a new dataset as shown below:
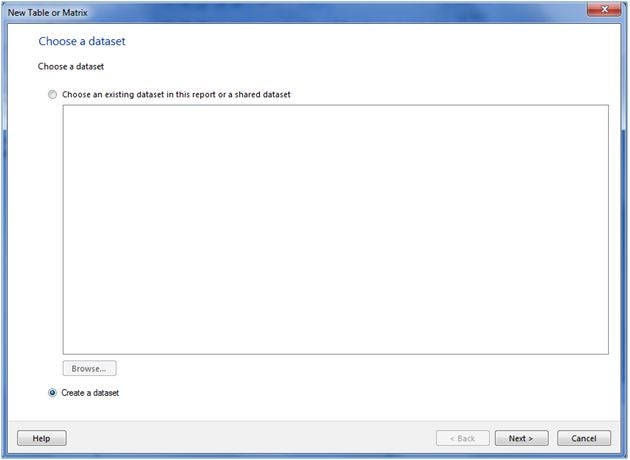
Figure 2 – New Table or Matrix report creation wizard
The next screen of the wizard asks the database connection string for the data source. Click on New button to specify the server and database name and so on to form connection string and click on Test Connection button to validate the connection string.
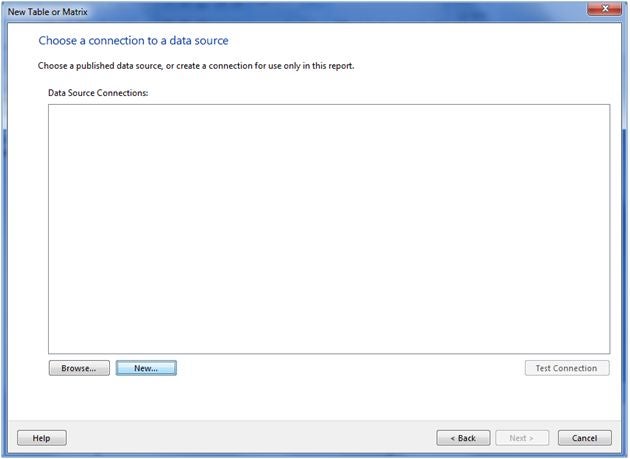
Figure 3 – New Table or Matrix report creation wizard
Once the data source gets created it will appear as shown below. If required you can edit the connection string or click on Test Connection to validate the connection string. Click on Next to move ahead.
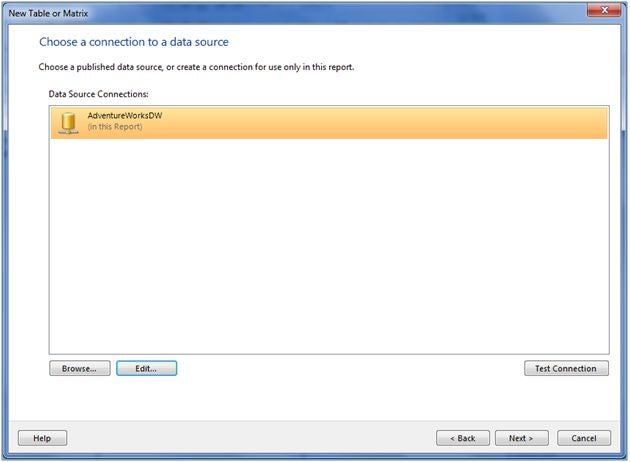
Figure 4 – New Table or Matrix report creation wizard
The next screen lets you design or specify the Query to run against the created/specified data source. This screen lets you directly write query or select the tables or views from the specified data sources. You can change the column order and put filters to be applied when pulling data from the data source.
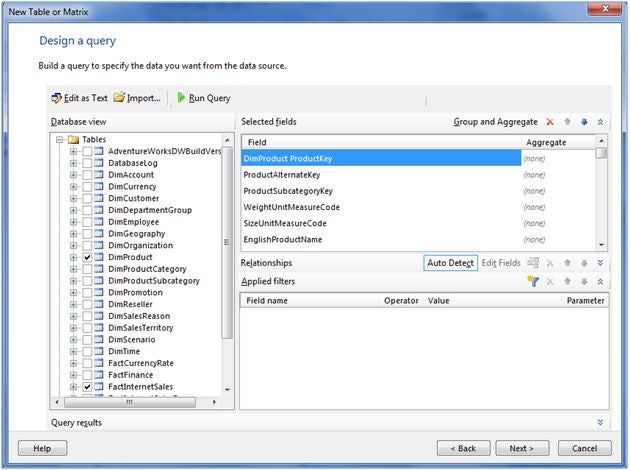
Figure 5 – New Table or Matrix report creation wizard
The next screen lets you arrange the columns/fields in rows, columns groups and specify the value to be displayed on the report. My requirement here is to display the sales amount per product and hence I have chosen ProductKey/ProductName as row group and Sum of sales amount as the value.
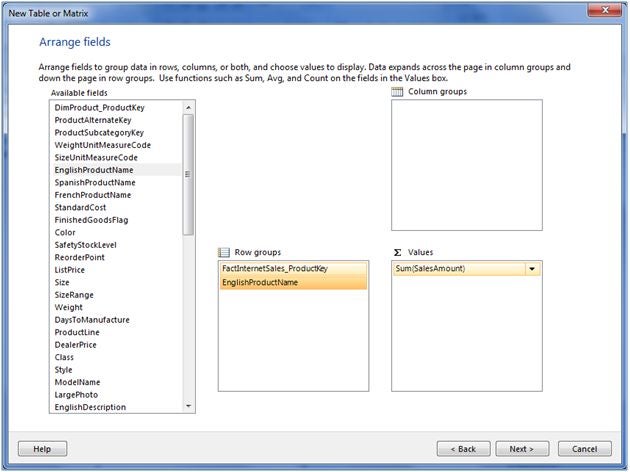
Figure 6 – New Table or Matrix report creation wizard
The next screen lets you choose the layout of the report; you can choose layouts to display subtotal above or below, etc. While making changes to the right side you can see the preview on the left side how would the report look like.
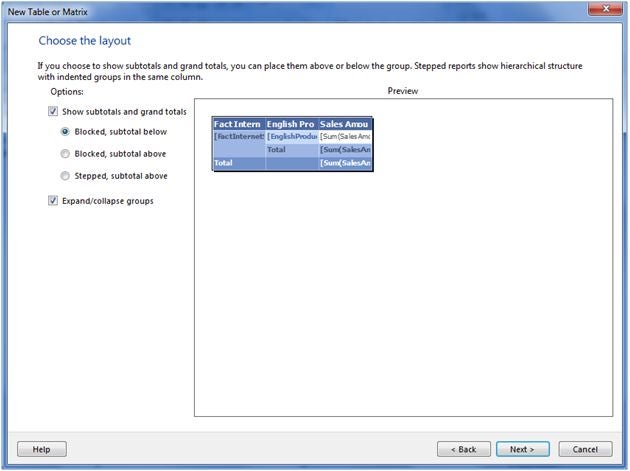
Figure 7 – New Table or Matrix report creation wizard
And the last screen lets you choose the style for your report, there is some built-in styling which you can use for your report. If required you can customize the styling as well.
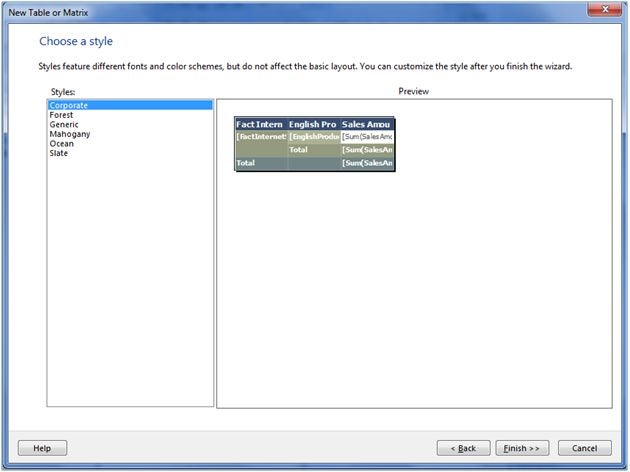
Figure 8 – New Table or Matrix report creation wizard
Now as the report wizard is over and report is created you would now be back in Report Builder User Interface (UI). In this UI, by default you can see the Report Data pane on the left side, on the right side would be Report Part Gallery, on the bottom you can notice row groups and column groups and in the middle you can see the report in design mode.
You can now hit F5 or click on Run ribbon item to preview the report. While being in preview mode, you can click on Design ribbon item to return back to design mode.
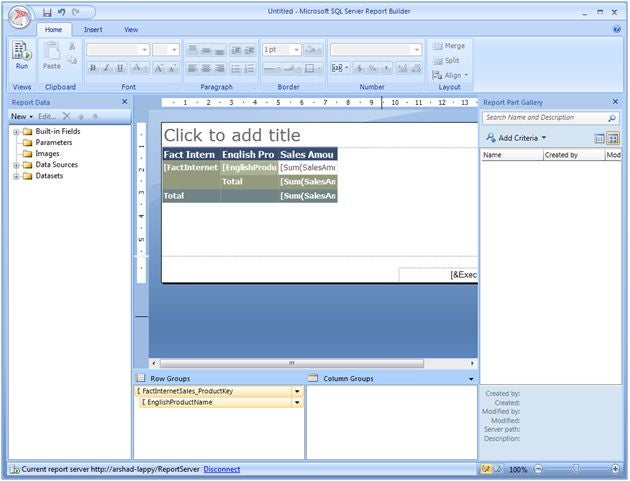
Figure 9 – Report Builder 3.0 UI
Once you are done with report design you can publish report parts or save the report either on the local drive or on the report server from where you can share it with others or run it as and when required. To save the report on the report server, click on Save or Save As menu item as below:
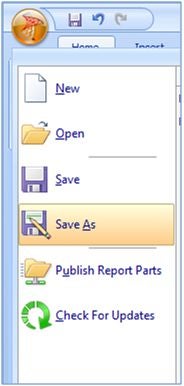
Figure 10 – Save a report
In my case I want to save my report on the report server, hence I have selected report server and the folder where I want to save it as shown below:
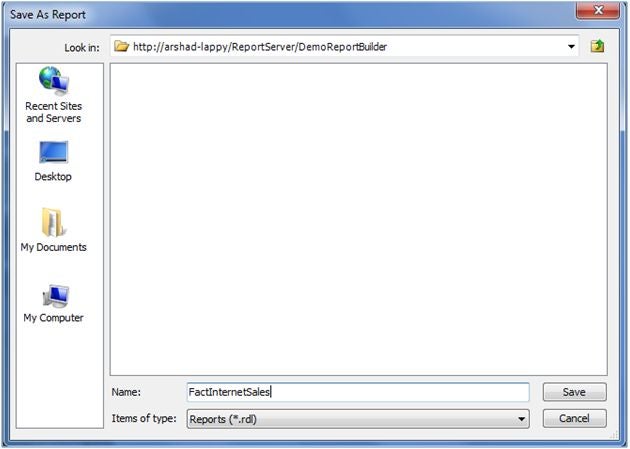
Figure 11 – Specify location to save report
Once saved, people with sufficient permissions on that saved report can browse it and view it as shown below:
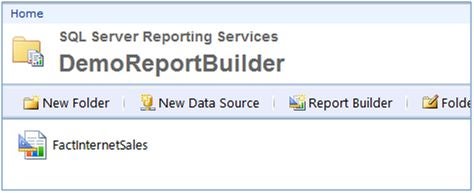
Figure 12 – Report Manager UI
You can view the report as shown below. You can export the report into different format if required:
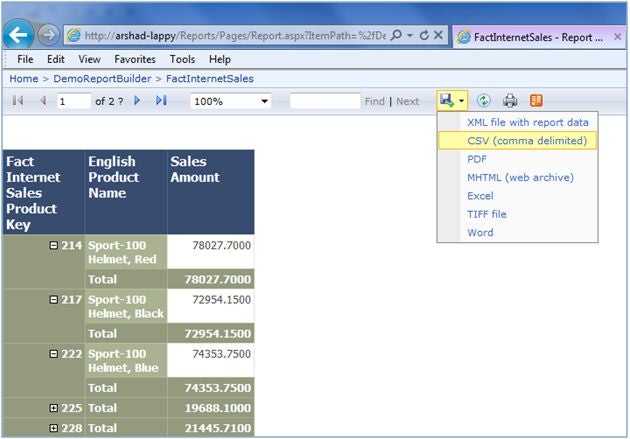
Figure 13 – Viewing a report
Conclusion
In this article I talked about Report Builder 3.0, which is a report development/authoring tool and primarily used by business users for ad-hoc report creation. I also talked about some of the new features of Report Builder 3.0.
Resources